Time Tracking On GitLab
Adding a feature to GitLab that provides a user-friendly report of time tracking.
I played the role of UX/UI designer and UX researcher to design this feature on GitLab. The timeline of the project spanned 4 weeks.
This project was selected based on my goal to contribute to open-source design. I found an issue on GitLab pertaining to time tracking that I wanted to focus on.
Problem
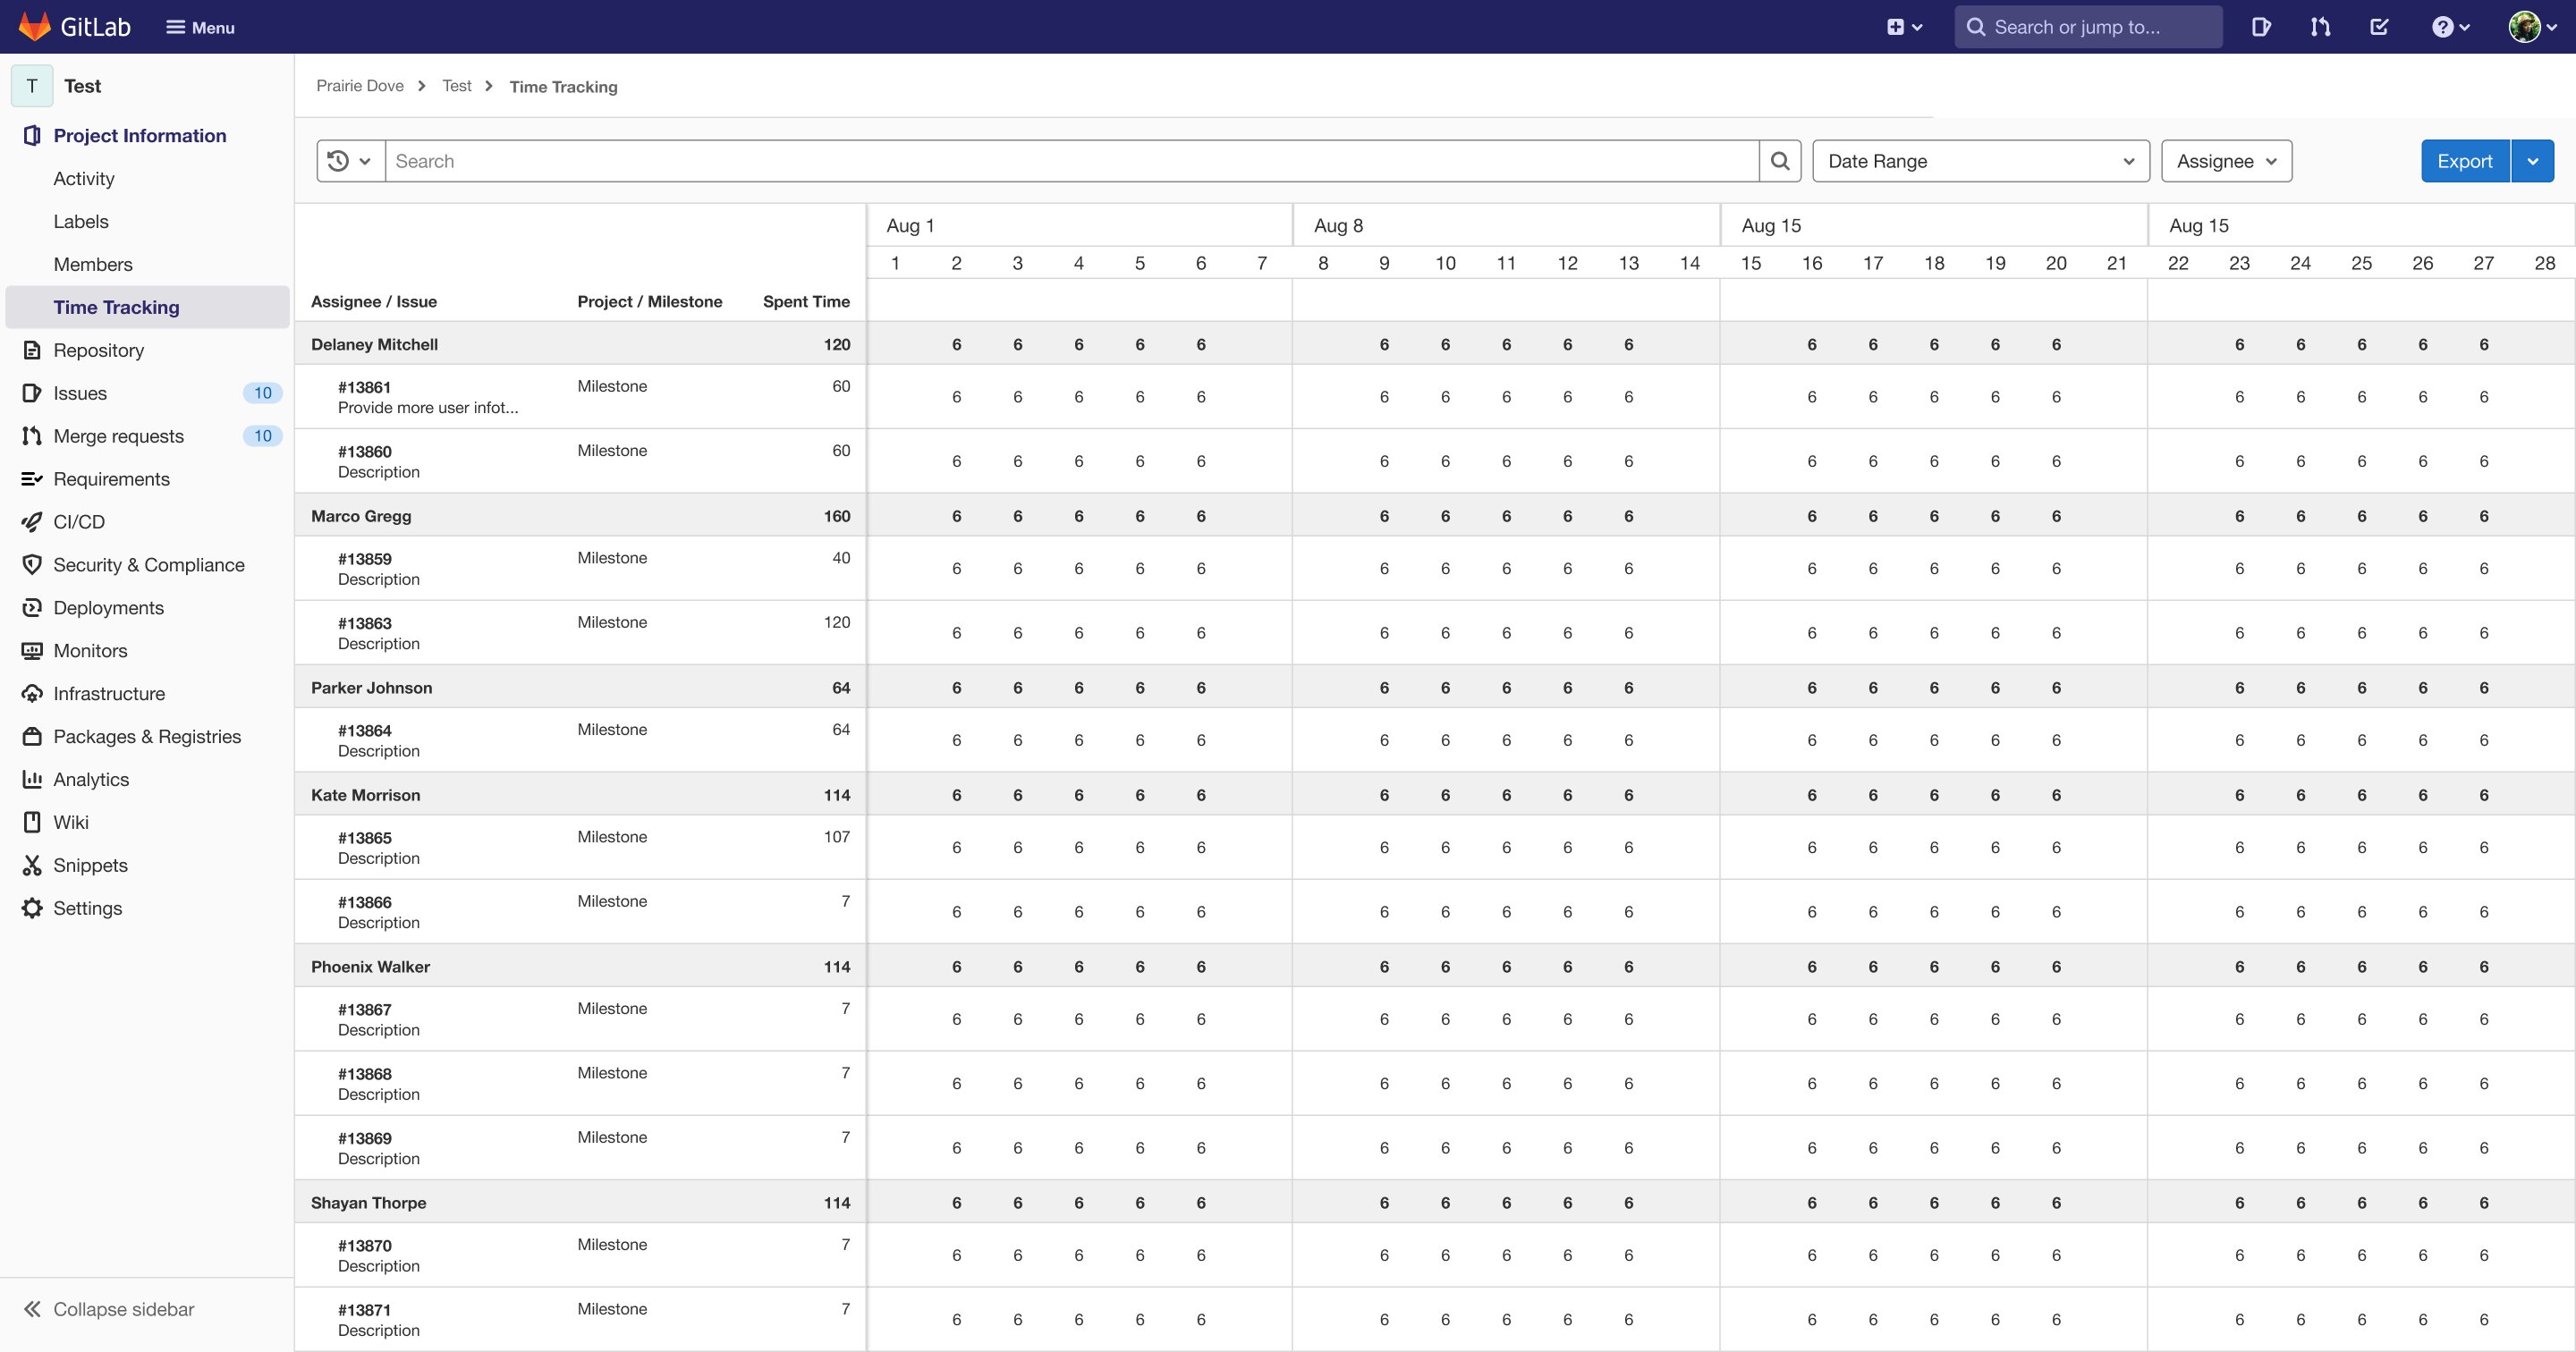
GitLab currently allows users to export a report of their issues, which includes the amount of spent and estimated time for each issue. But there is no method on the interface to view or filter categories for the report.
Solution
Design a report within the interface that users can view their time tracking report. The report should allow users to filter and group information relevant to the issues of a project. Users should be able to export this report from the interface as well.
Empathizing With Users
Initial research consisted of secondary and primary research methods.
- Secondary research methods were market research then competitive analysis.
- Primary research was completed through user interviews. A total of 3 participants were recruited, who had experience with time tracking and project management software.
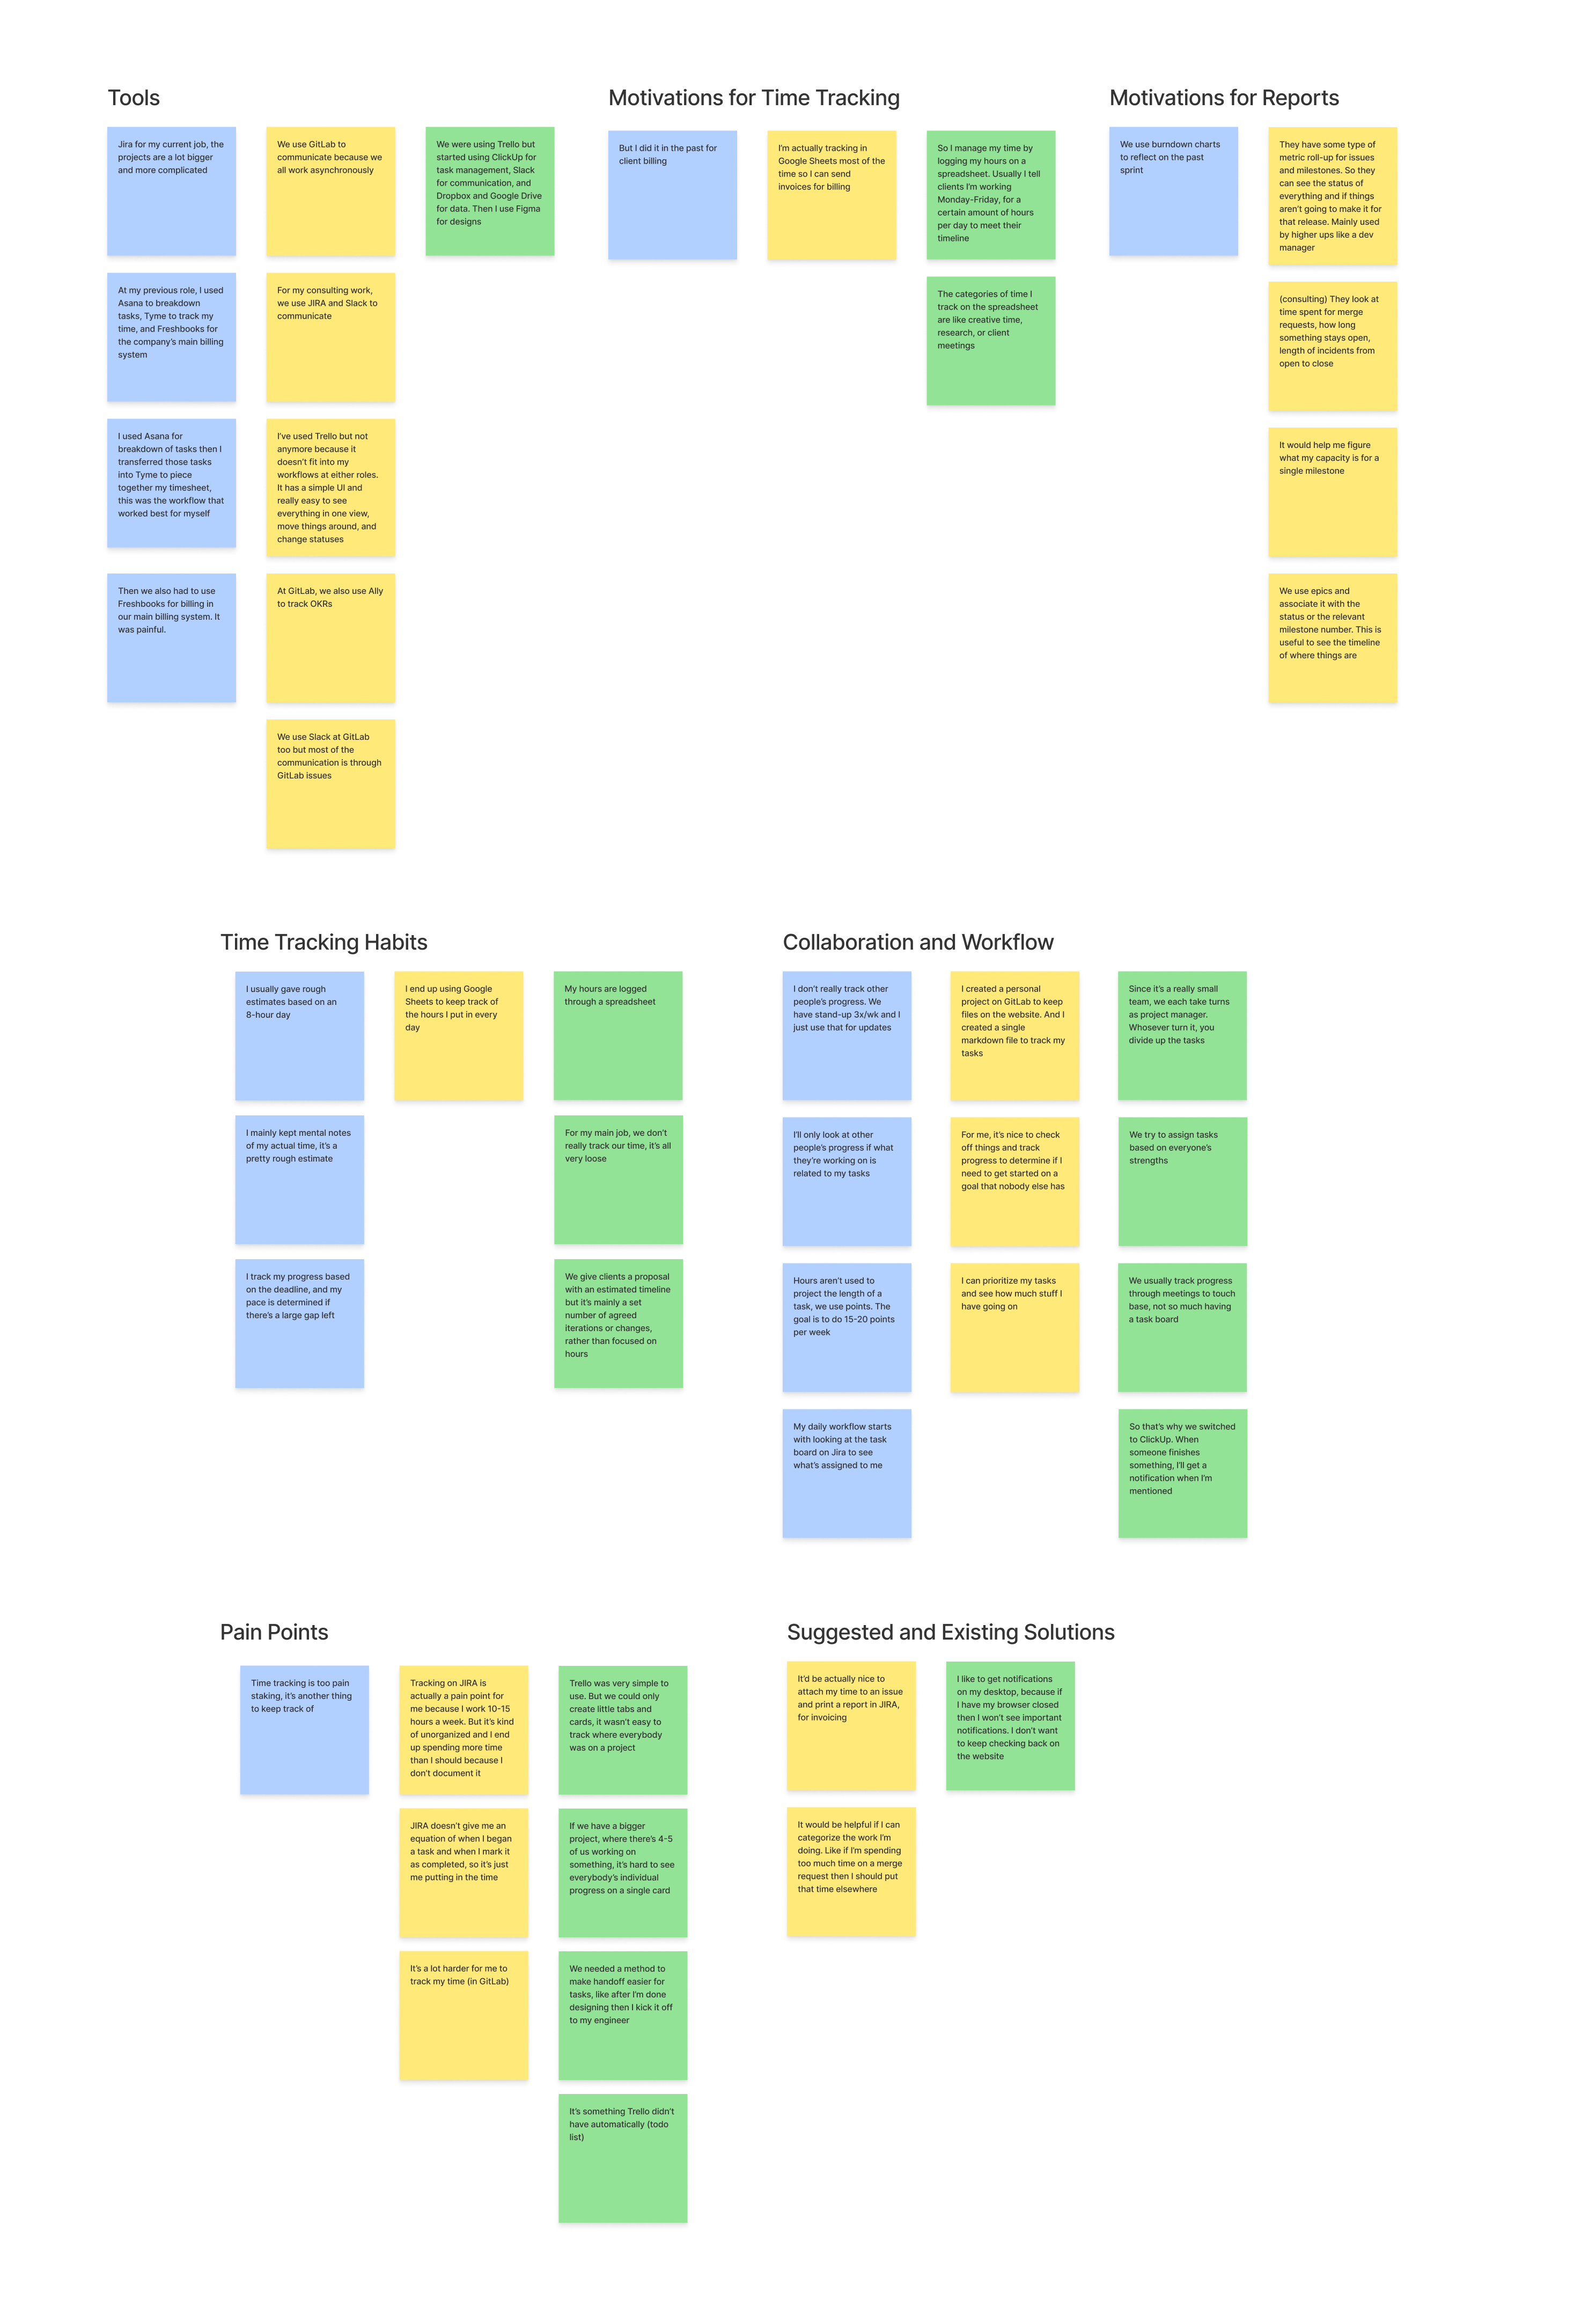
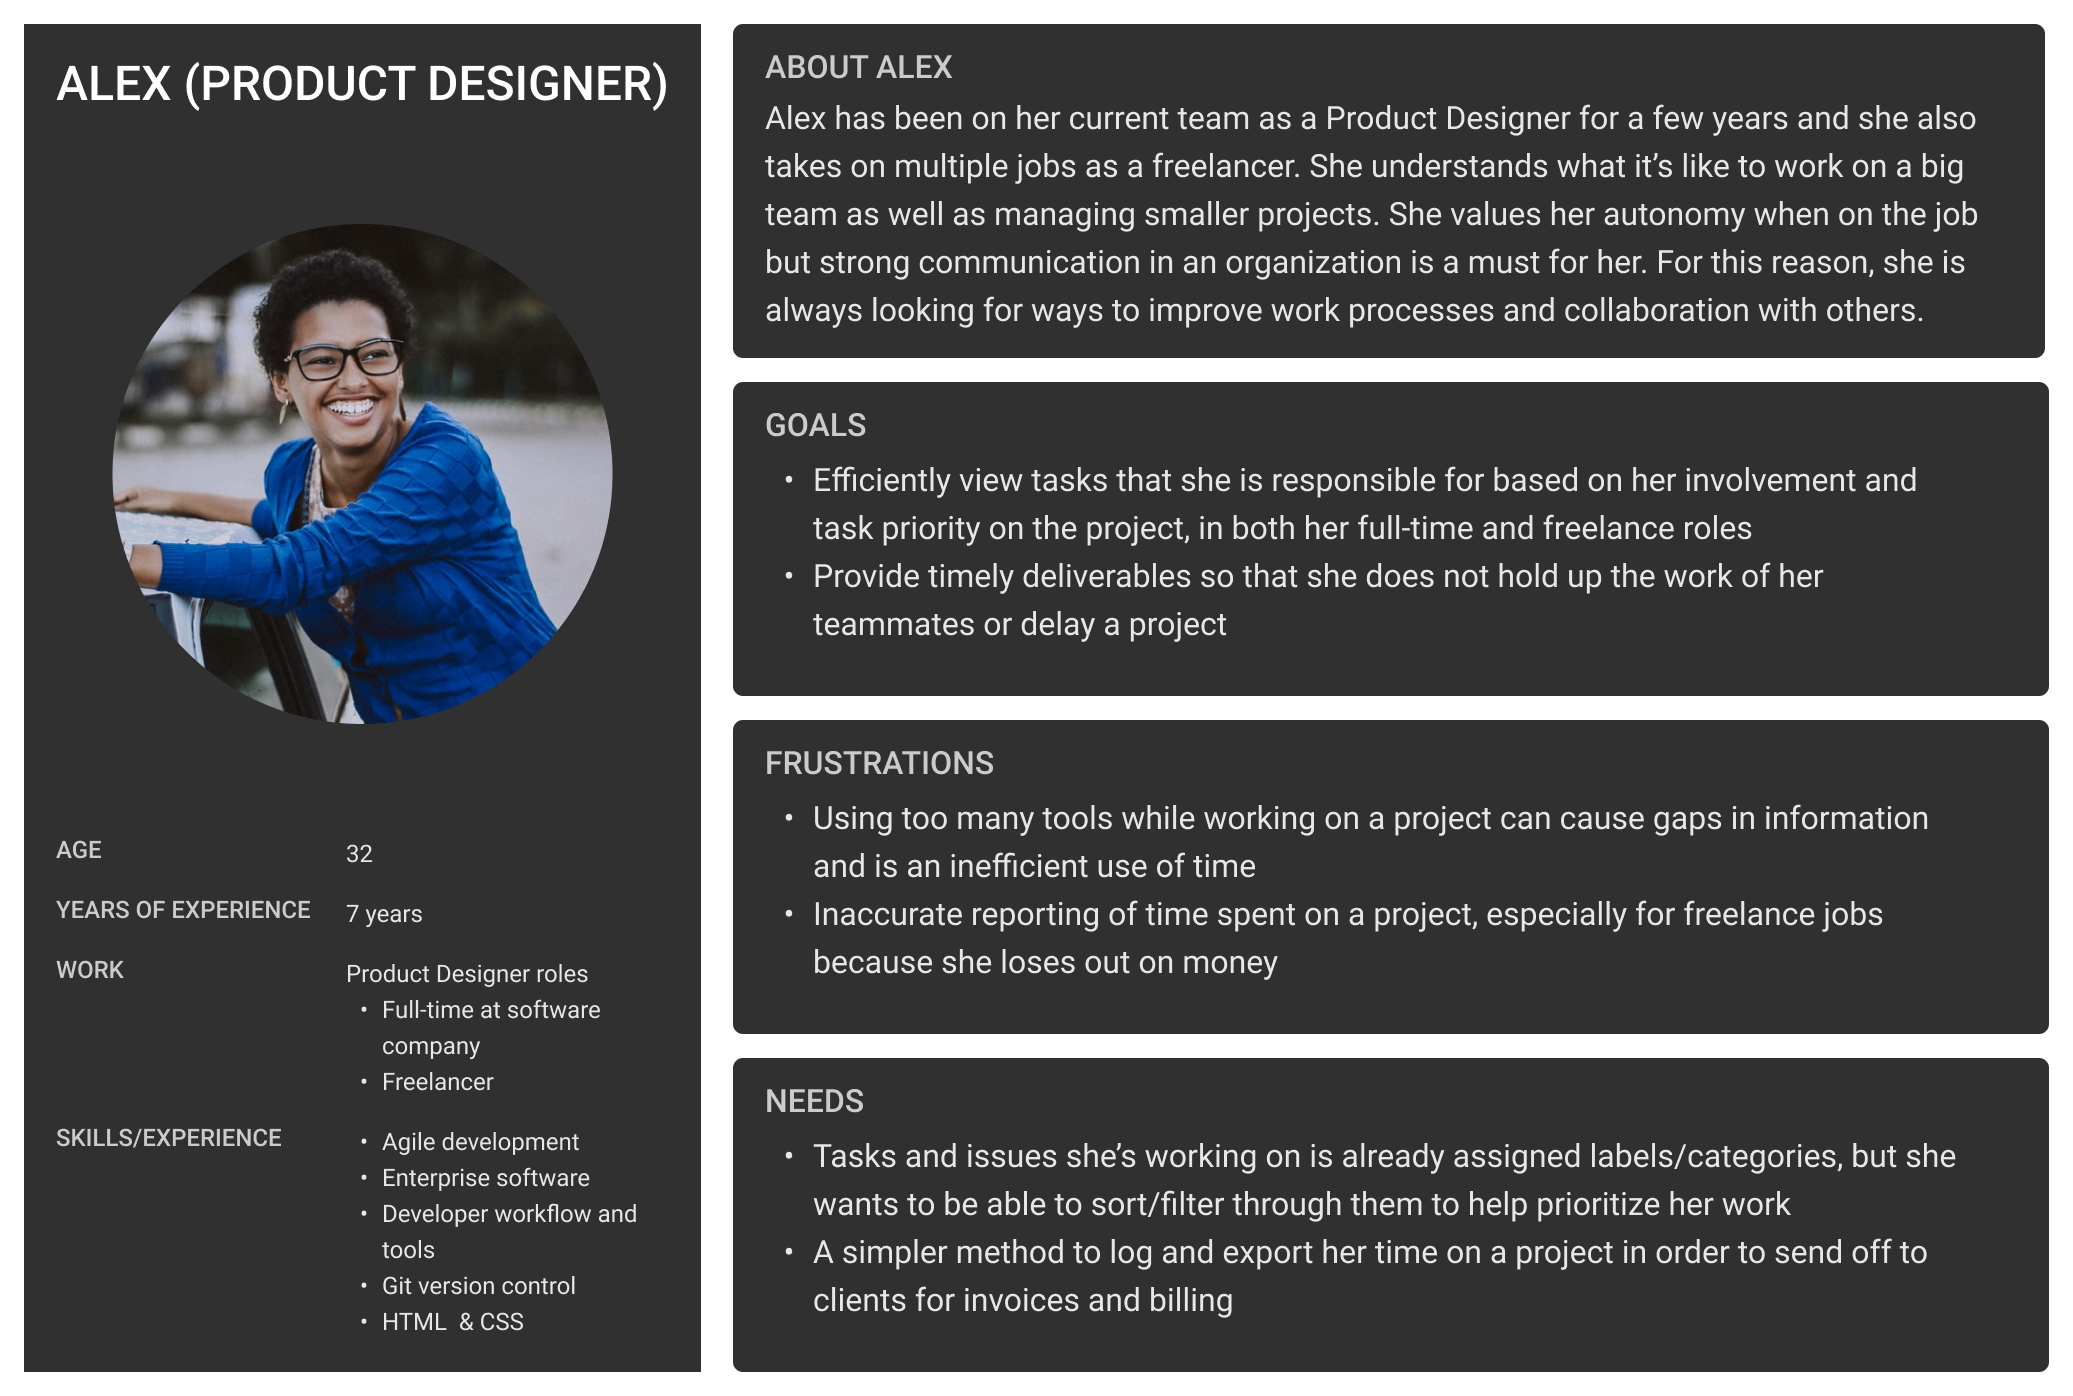
The research findings provided many insights, including the fact that teams want methods to streamline work processes. These insights were compiled to create the primary persona that will guide the next design steps.
Users seek a way to reduce additional steps in their workflow to track and report time.
Tree Testing
A tree test was used to determine where time tracking would be on the GitLab interface. The existing GitLab navigation items were used to set up the tree test. The goal of the tree test was to use this existing taxonomy, instead of creating a new one.
Optimal Workshop was used to send out remote tests to 10 participants, with 1 participant abandoning the test. Due to resource constraints, more participants were not able to be recruited.
Results and Insights
Based on the tree test findings, nesting the time tracking within Project Information made the most sense. The goal of the primary persona is to export time reports spent on specific projects during a specific date range. This decision aligns with the goals and needs of the primary persona.
Sketches
The sketches explored ways users would interact with the filters and the visual hierarchy of the report data. There was a question of whether users should view their report in a calendar view or in a report summary format. These sketches led to the choice of using a calendar view, as it is more natural to navigate. For more detail, view the annotated sketches.
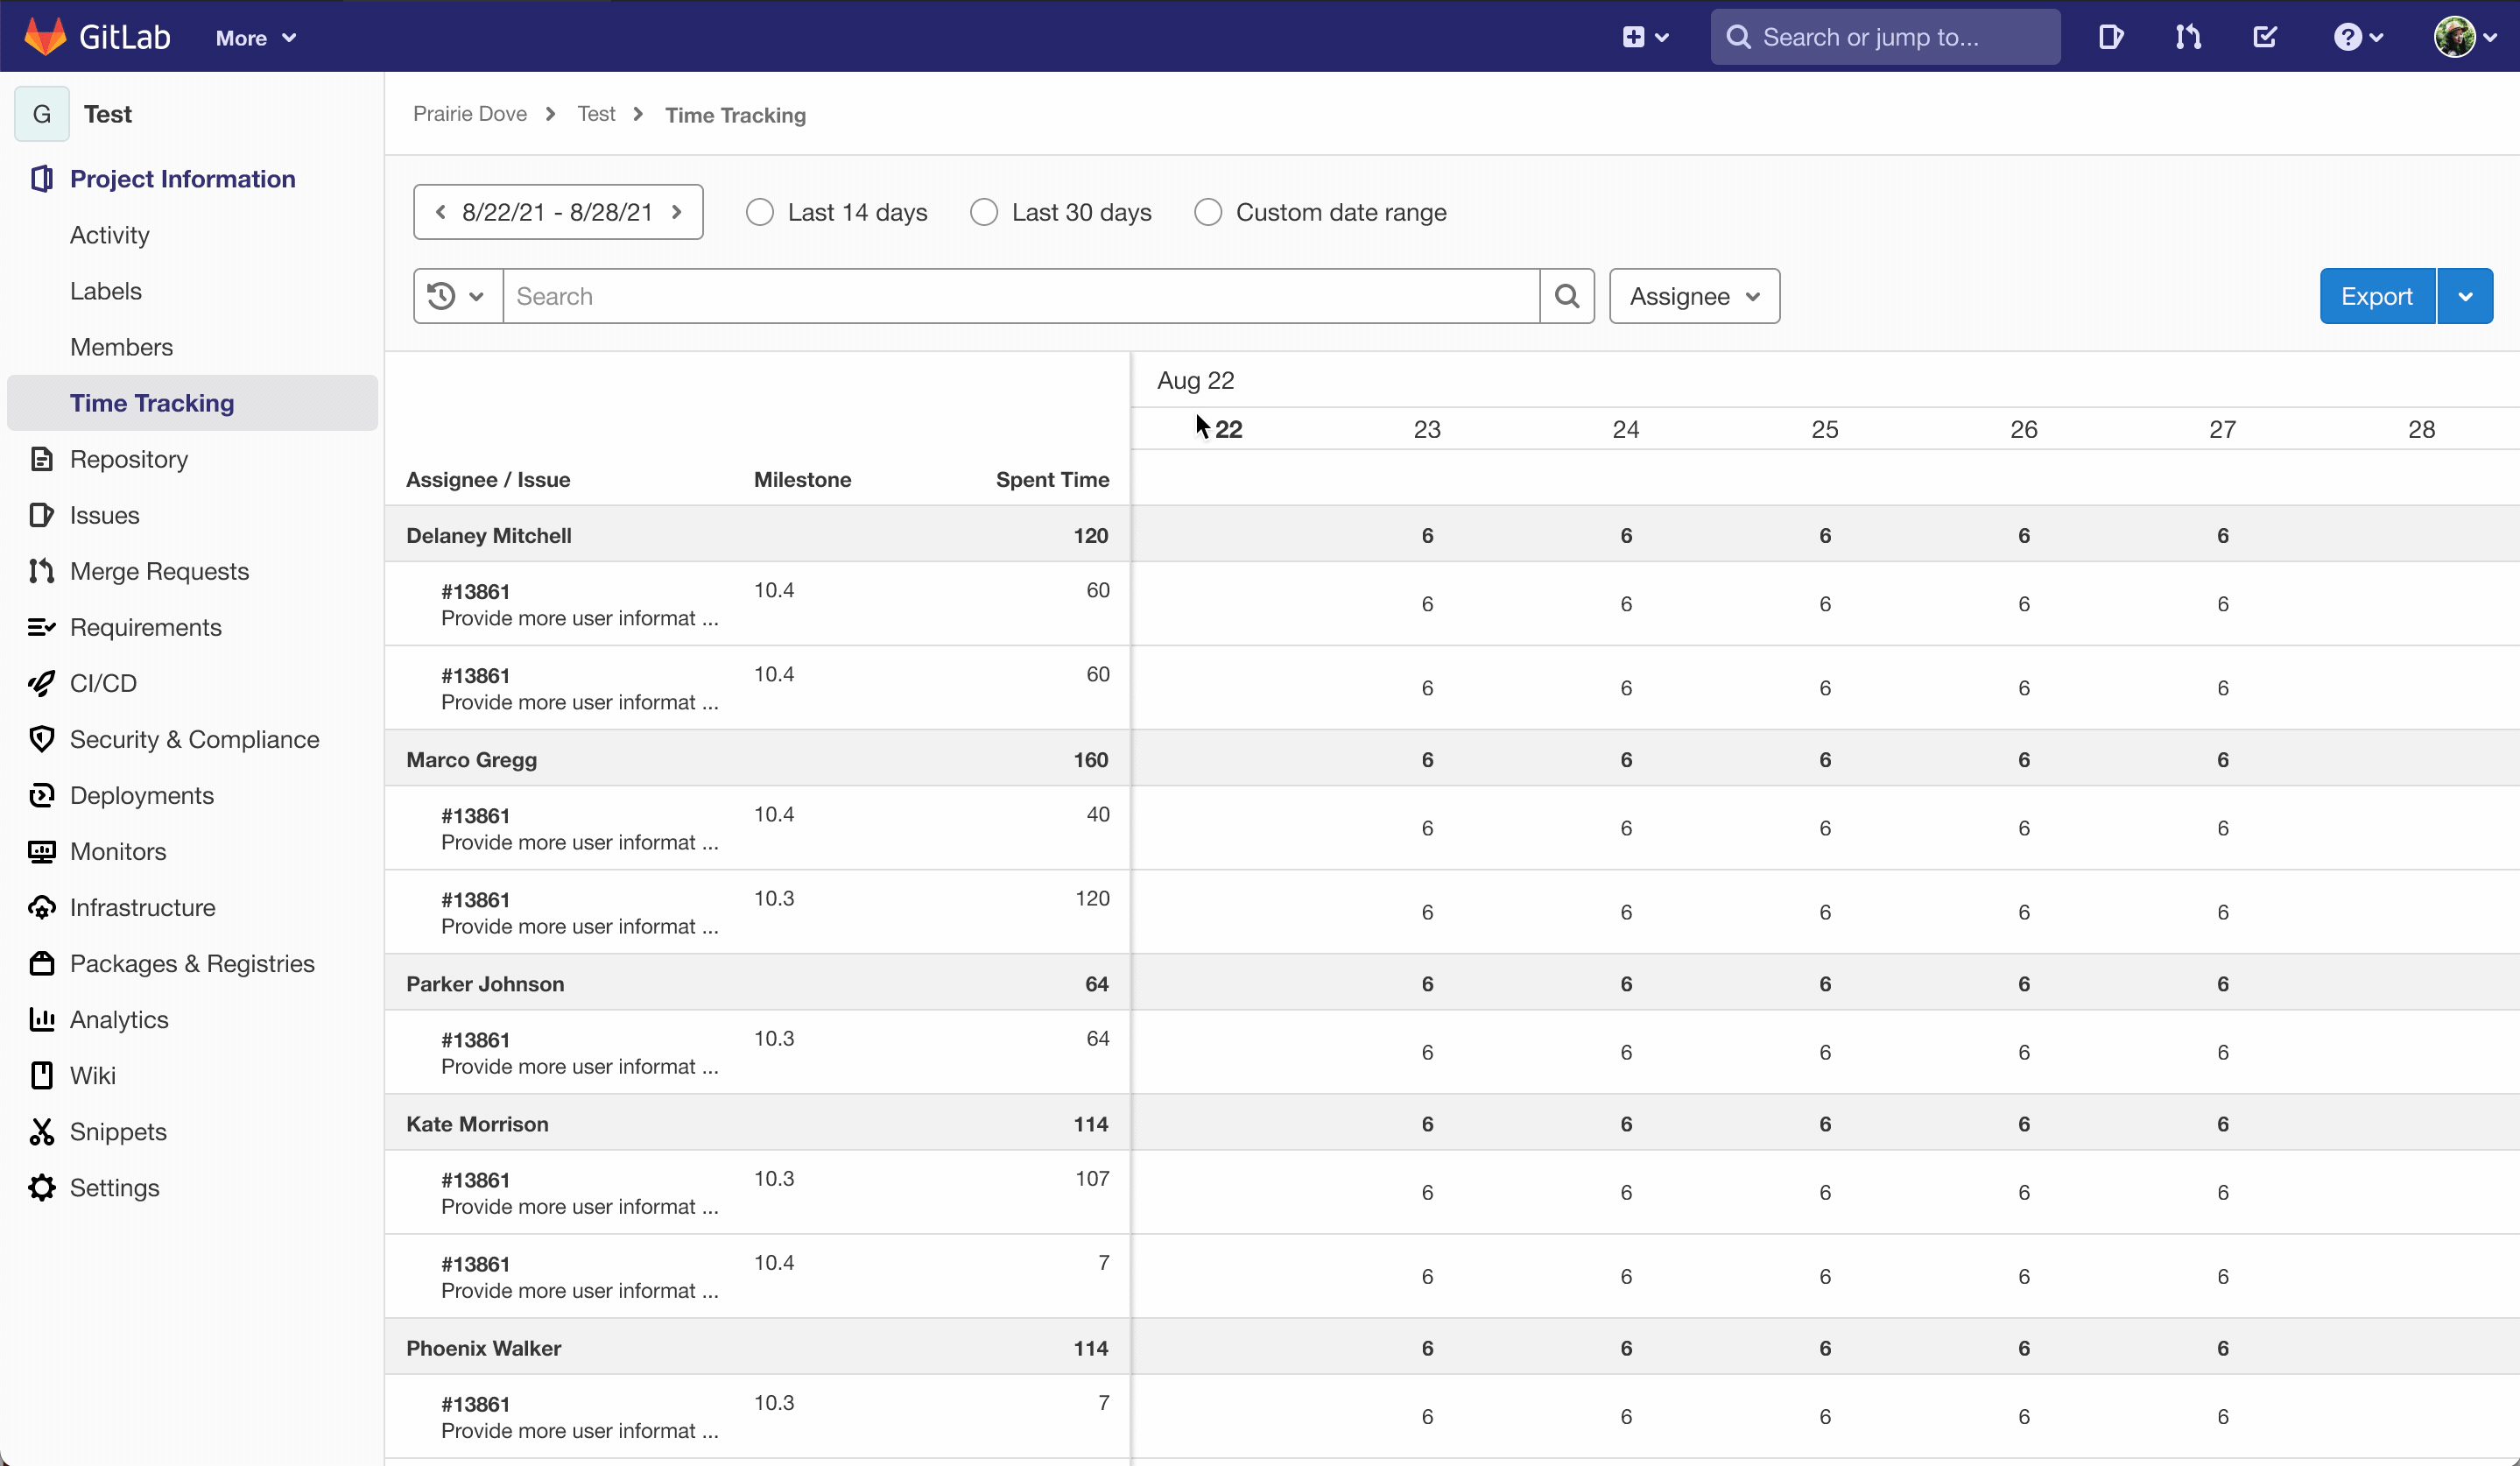
High-Fidelity Prototype
The full user flow of the prototype started from the group page to the time report that is nested within the project information. The prototype was prepared to test the changing of the date range.
Usability Testing
Plan
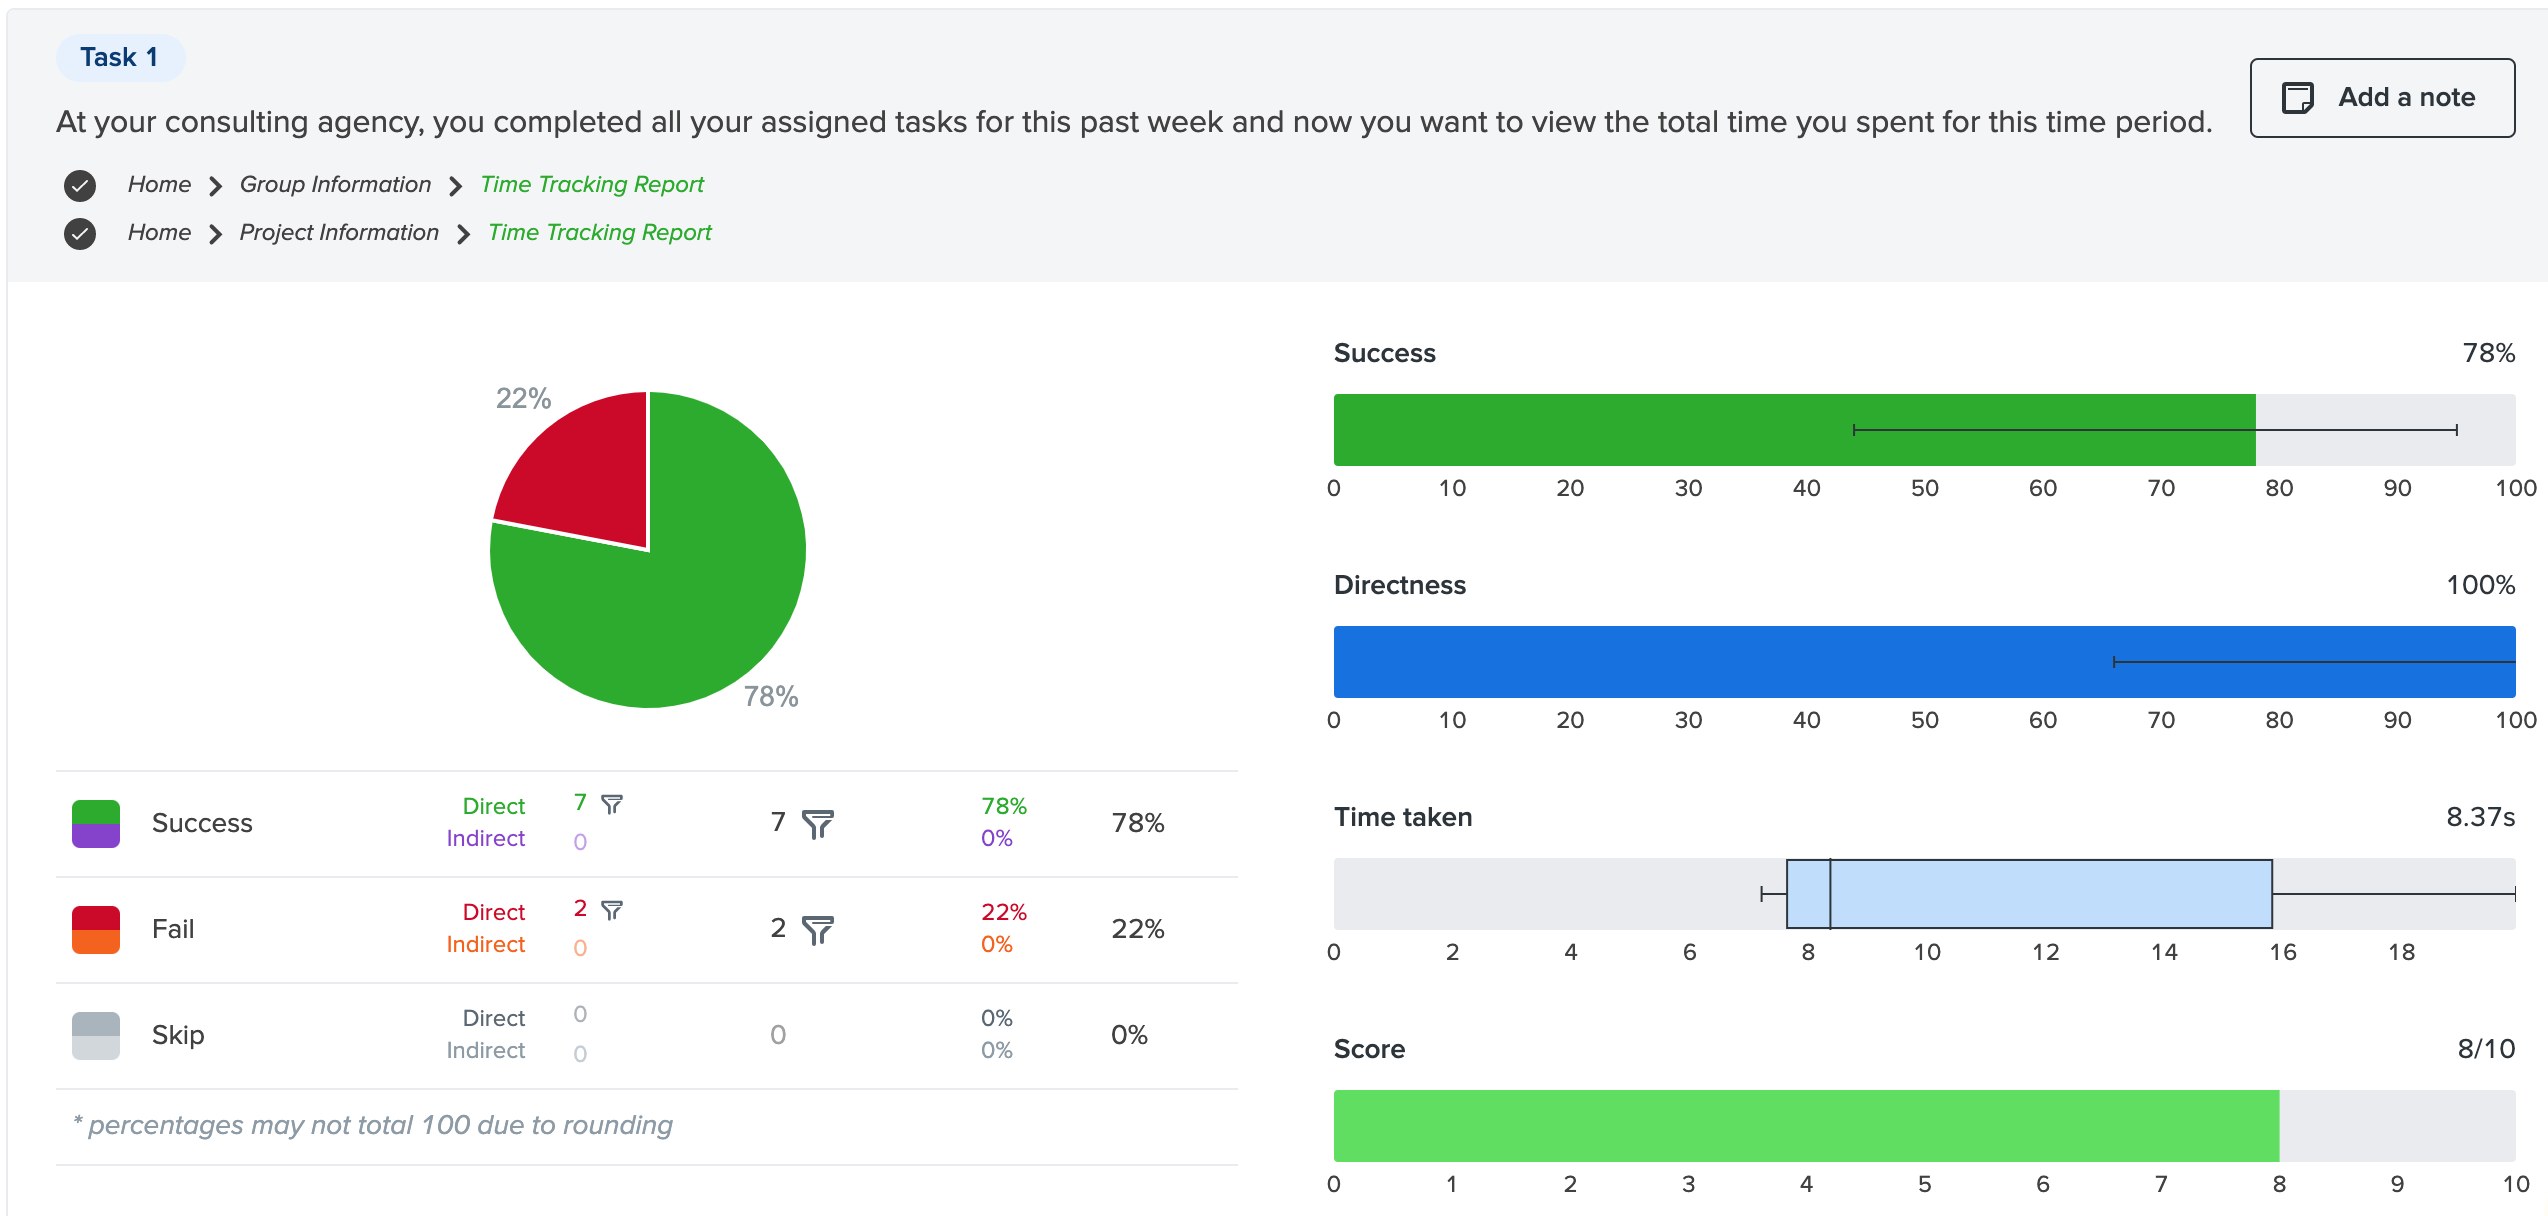
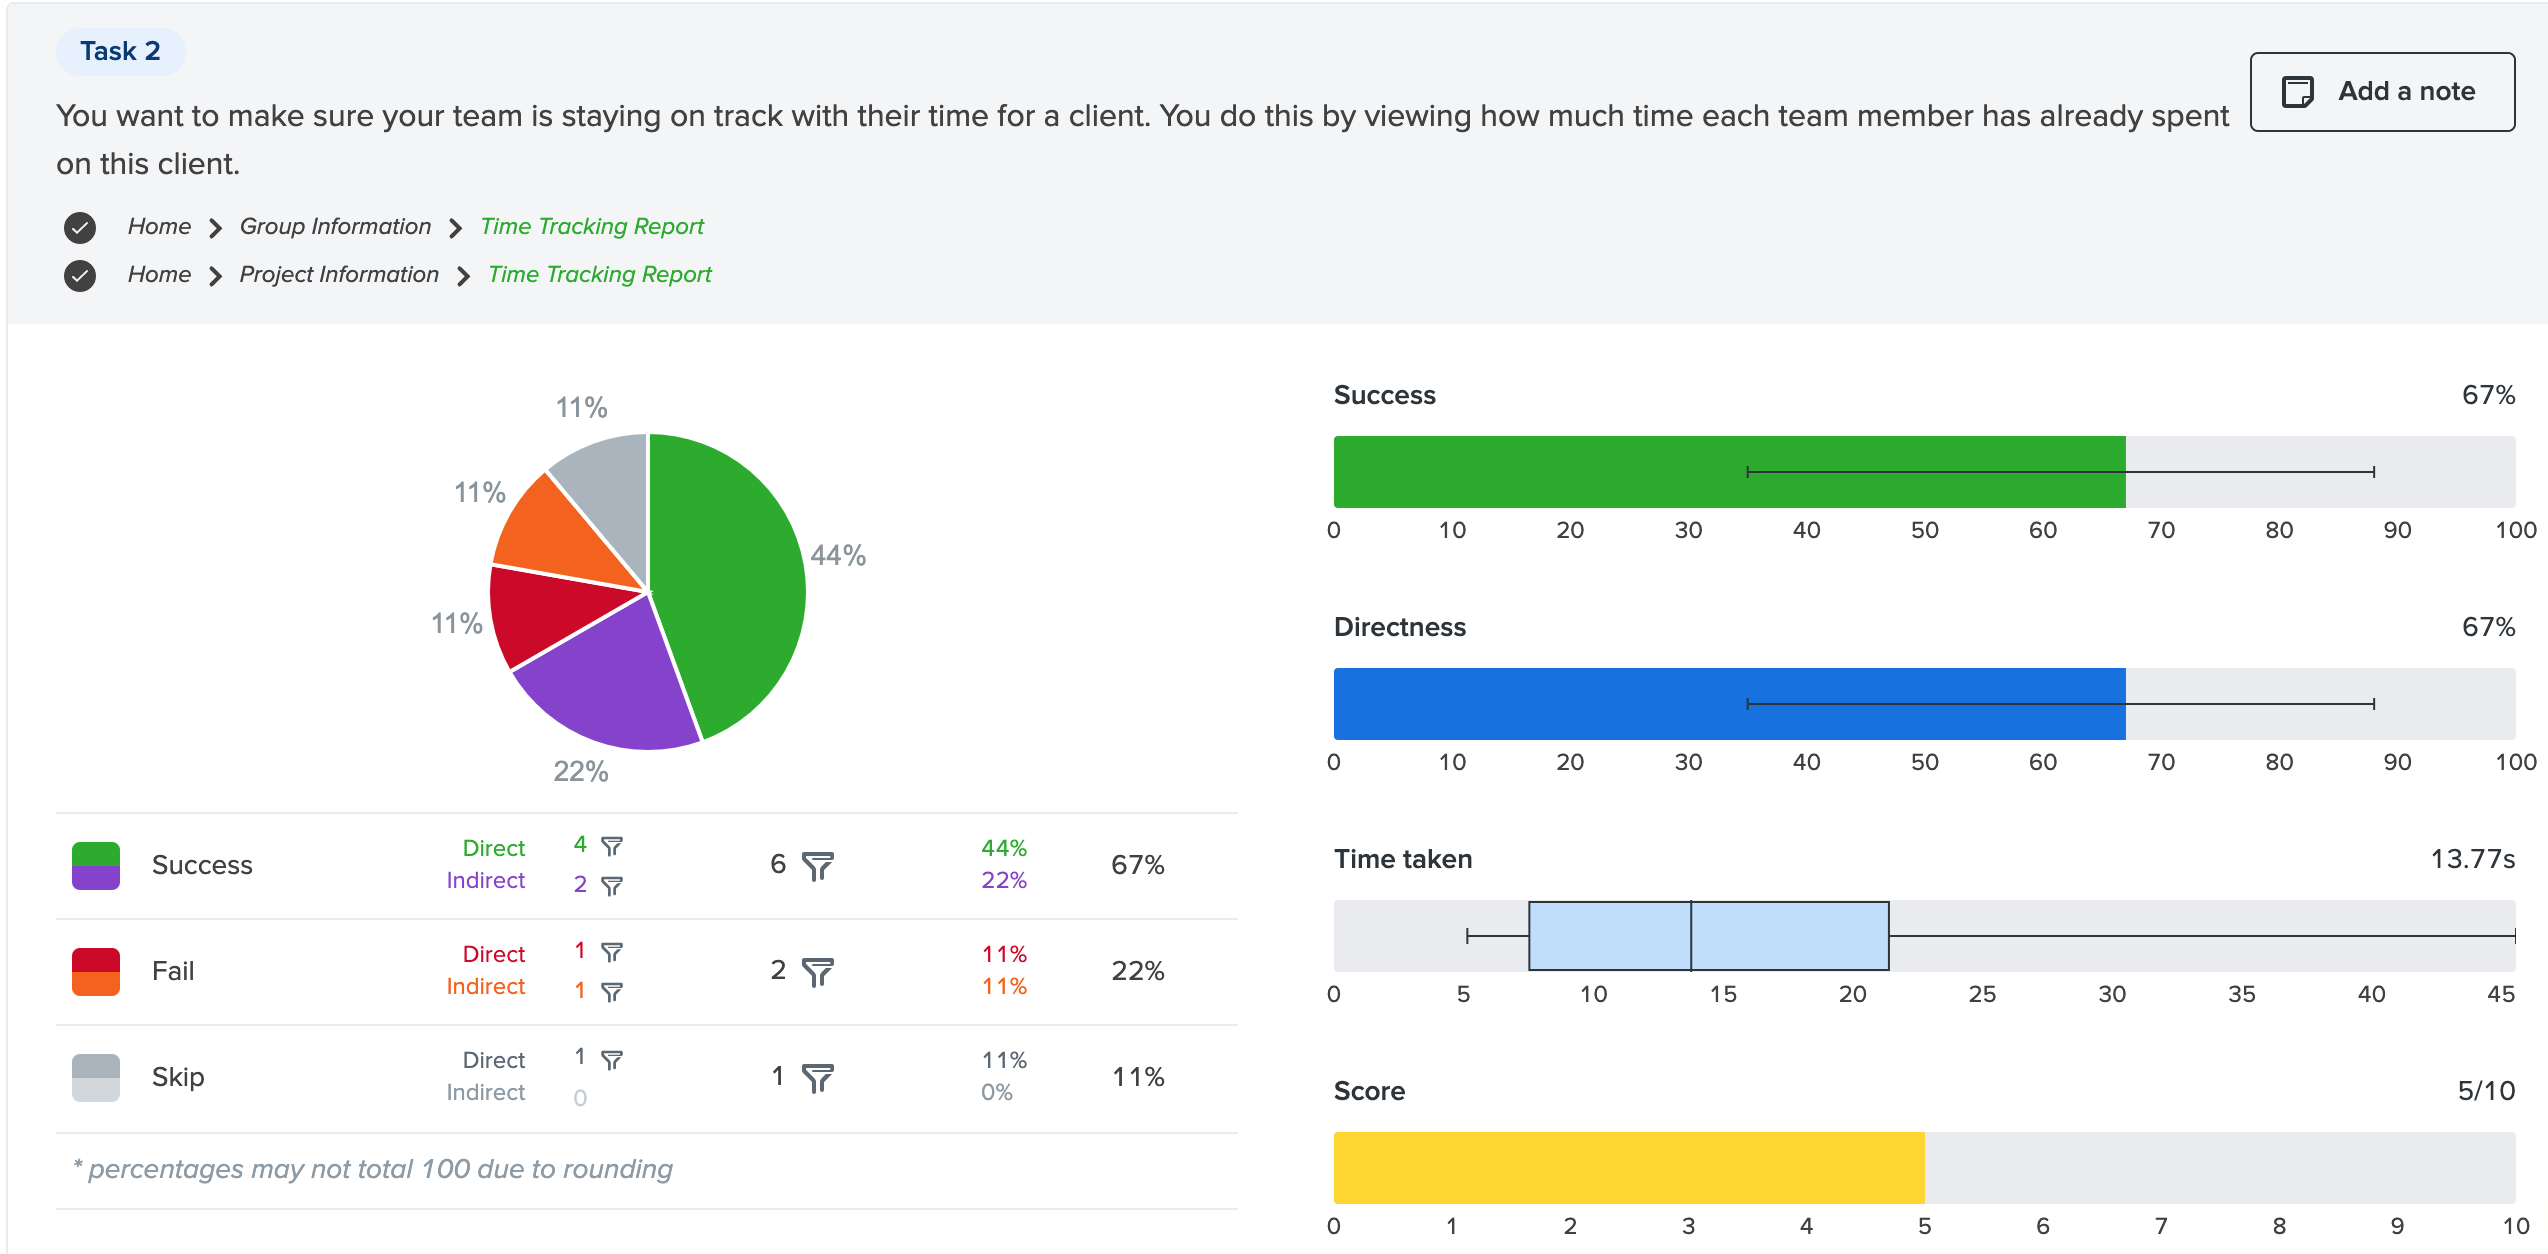
The first version of the prototype underwent usability testing with remote, moderated interviews. A total of 3 participants were recruited to conduct the usability test. The objective of the test was to gather success rates of navigating to the report, changing date ranges, applying a filter, and exporting the report. Likert scales were also used to follow-up each task in order to rate the experiences.
Success Rates
- 100% success rate for navigating to the report, changing date ranges, and exporting the report
- 33% success rate in applying filters, primarily because not all participants were familiar with GitLab’s search pattern.
Pain Points
- The overwhelming view of the report
- Confusing dropdown menu next to the search input field
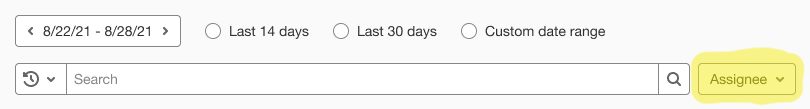
The highlighted item is the dropdown that enables users to group the report by Assignee or Issues.
Insights and Next Steps
- An increased amount of elements on the page can overwhelm users when viewing a report. Reducing the clutter on the page will improve the user experience
- Labeling of options should help users anticipate the action when they interact with the element, such as the confusing dropdown to group the report
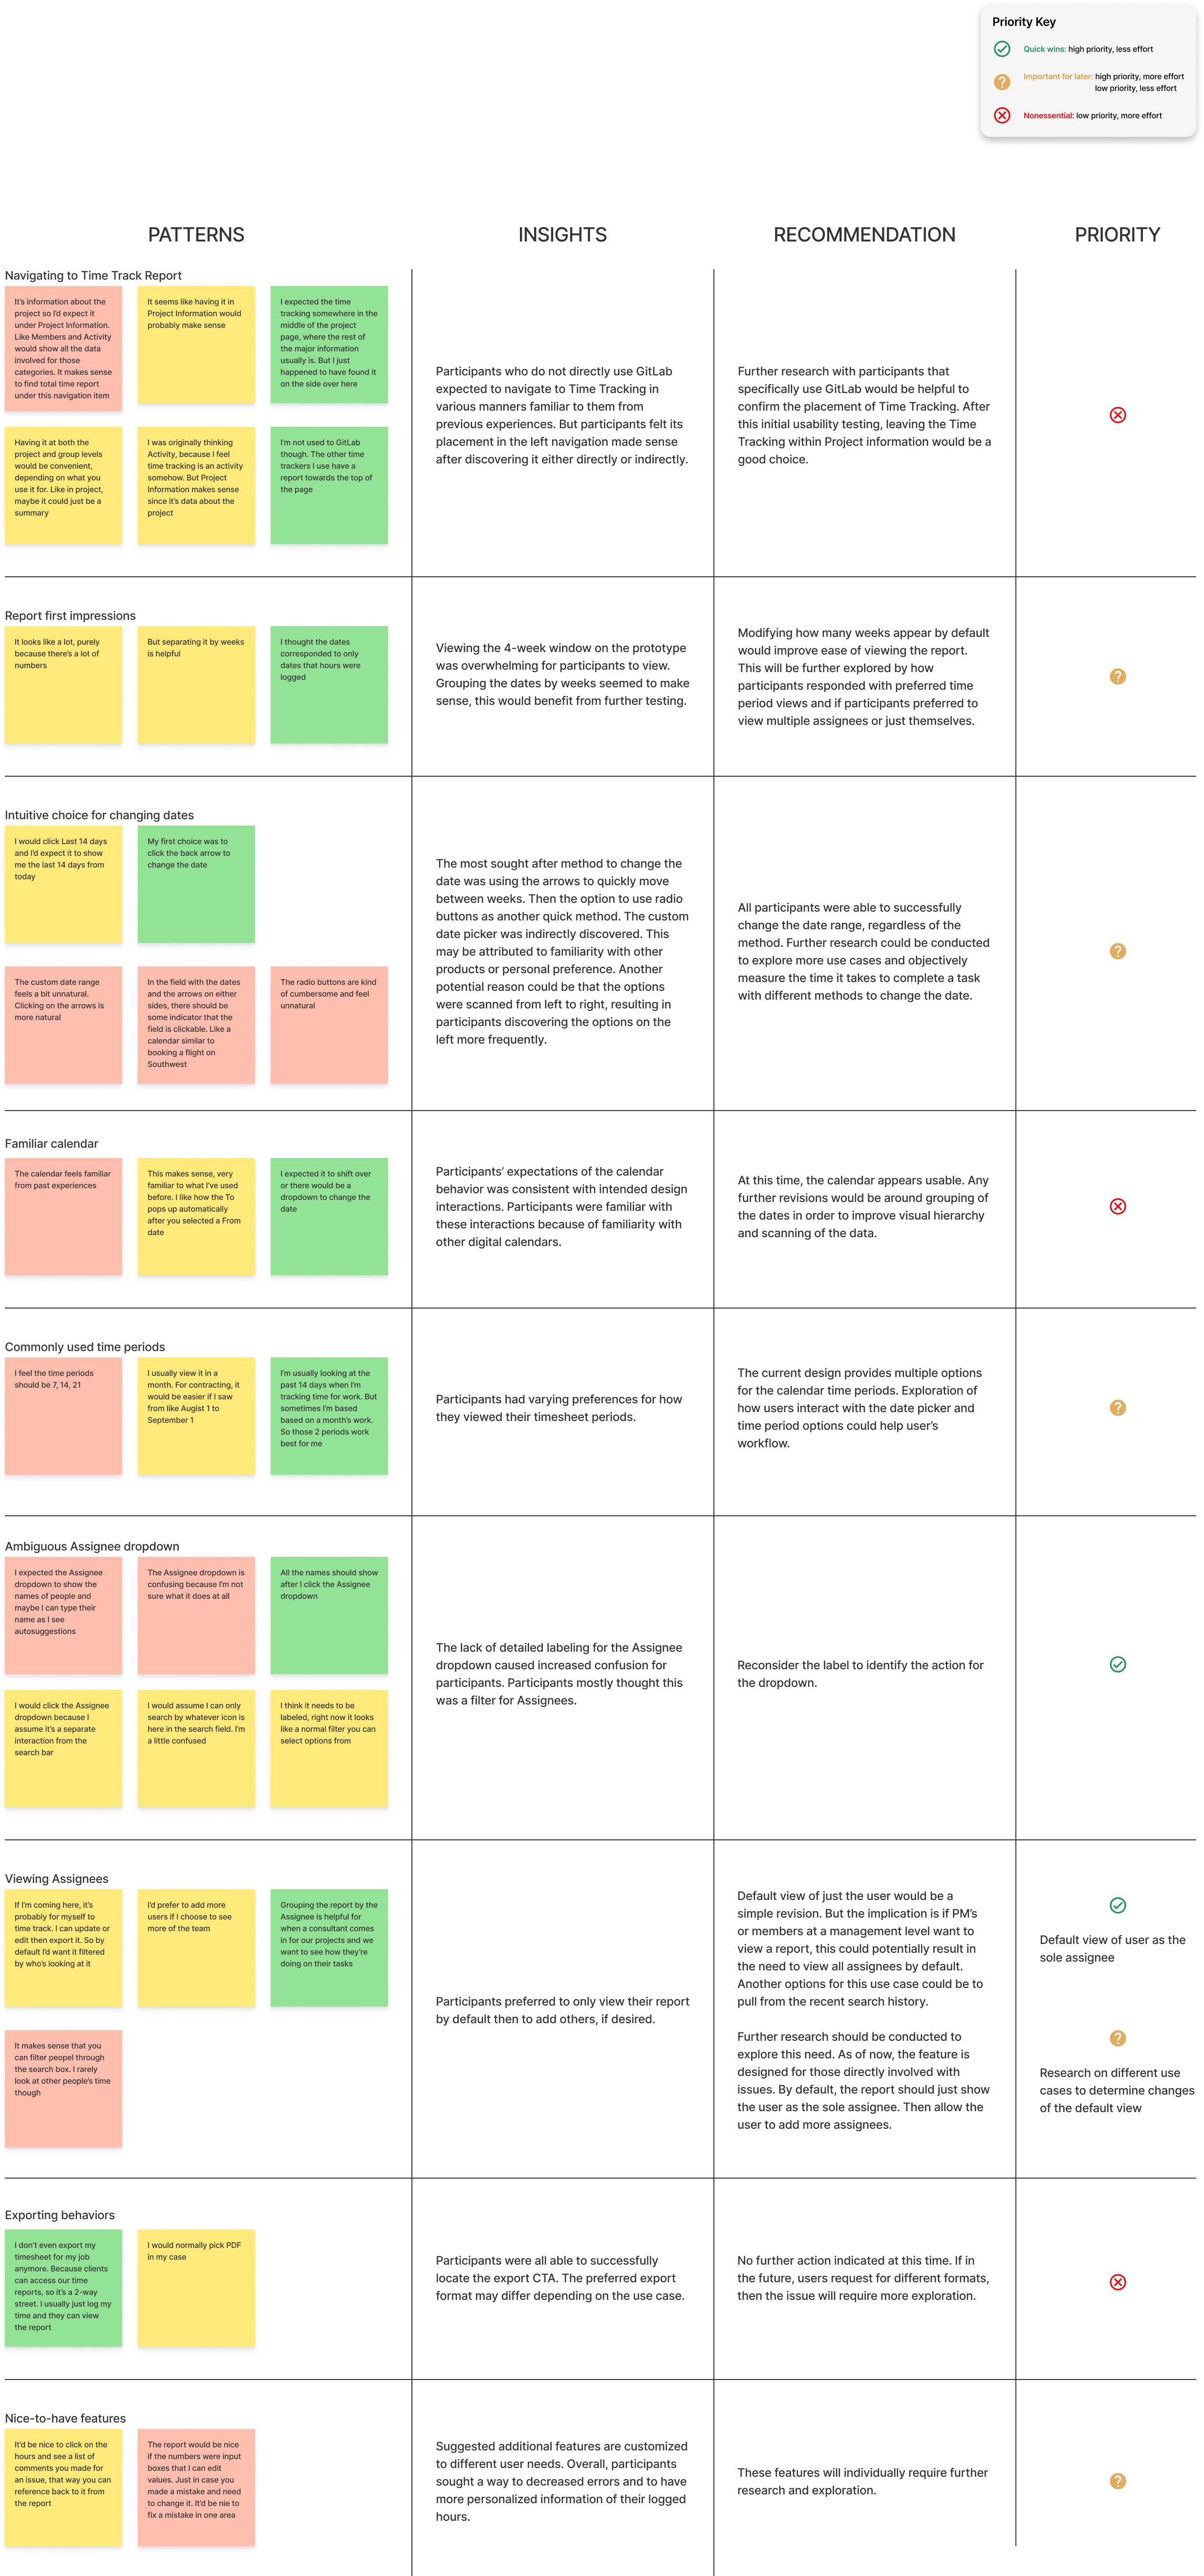
After gathering the usability test findings, an affinity diagram helped to prioritize the next steps based on available resources. Many of the patterns that needed improvement identified would require additional resources for research, as a result, were prioritized for later.
The immediate priority revisions are to improve the date picker and to label the dropdown menu that enables users to group the report.
Priority Revisions
Below are the before and after prototype of the project. To access the revised prototype, click here.
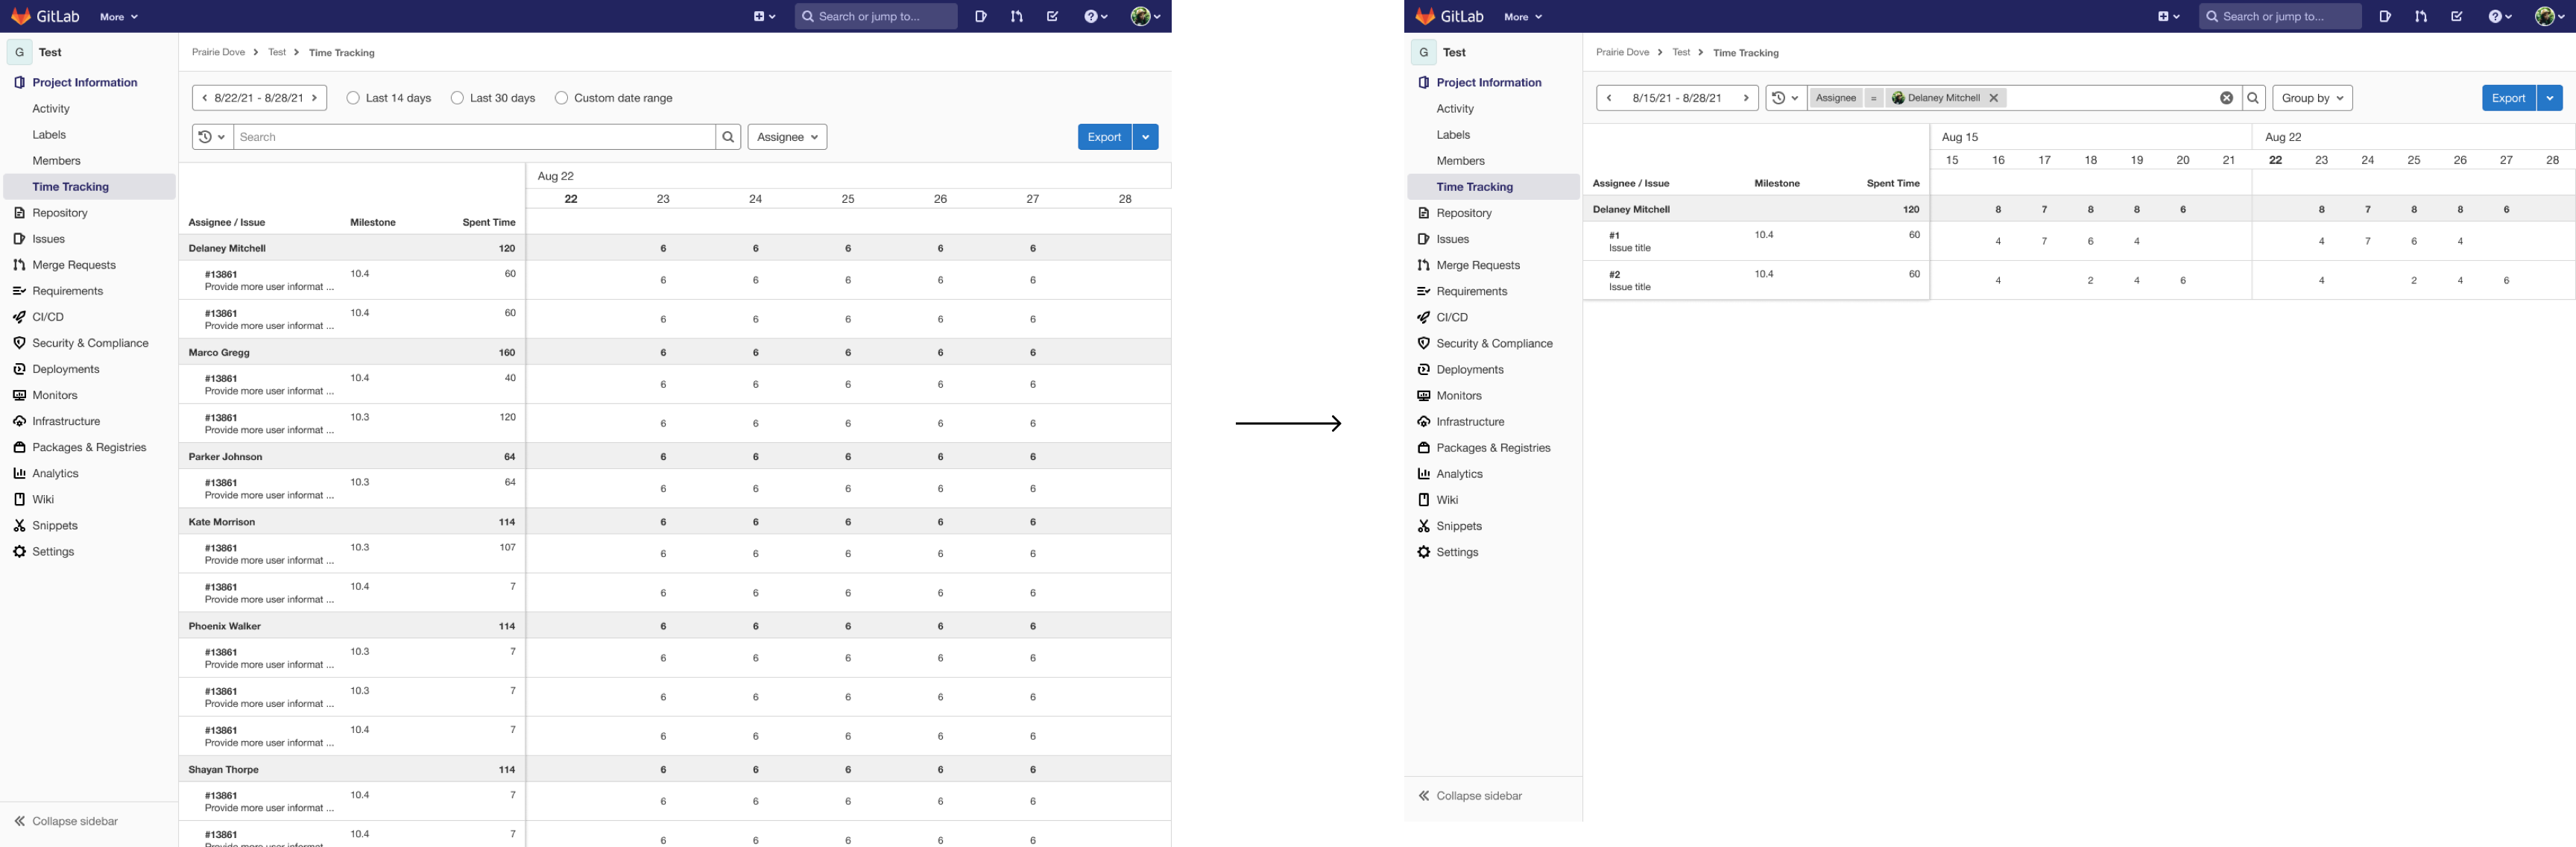
To reduce clutter, users view themselves as the assignee. This would be applied to the filter field. Users can edit the filter to add more assignees. Instead of just seeing the current week, users see the current and past week.

Users interact with the date range field in order to trigger a dropdown for date options. Since the report will show just the user as an assignee, there will be a filter applied by default to reflect this. The Group by dropdown has been relabeled to reflect the action, instead of the selection.
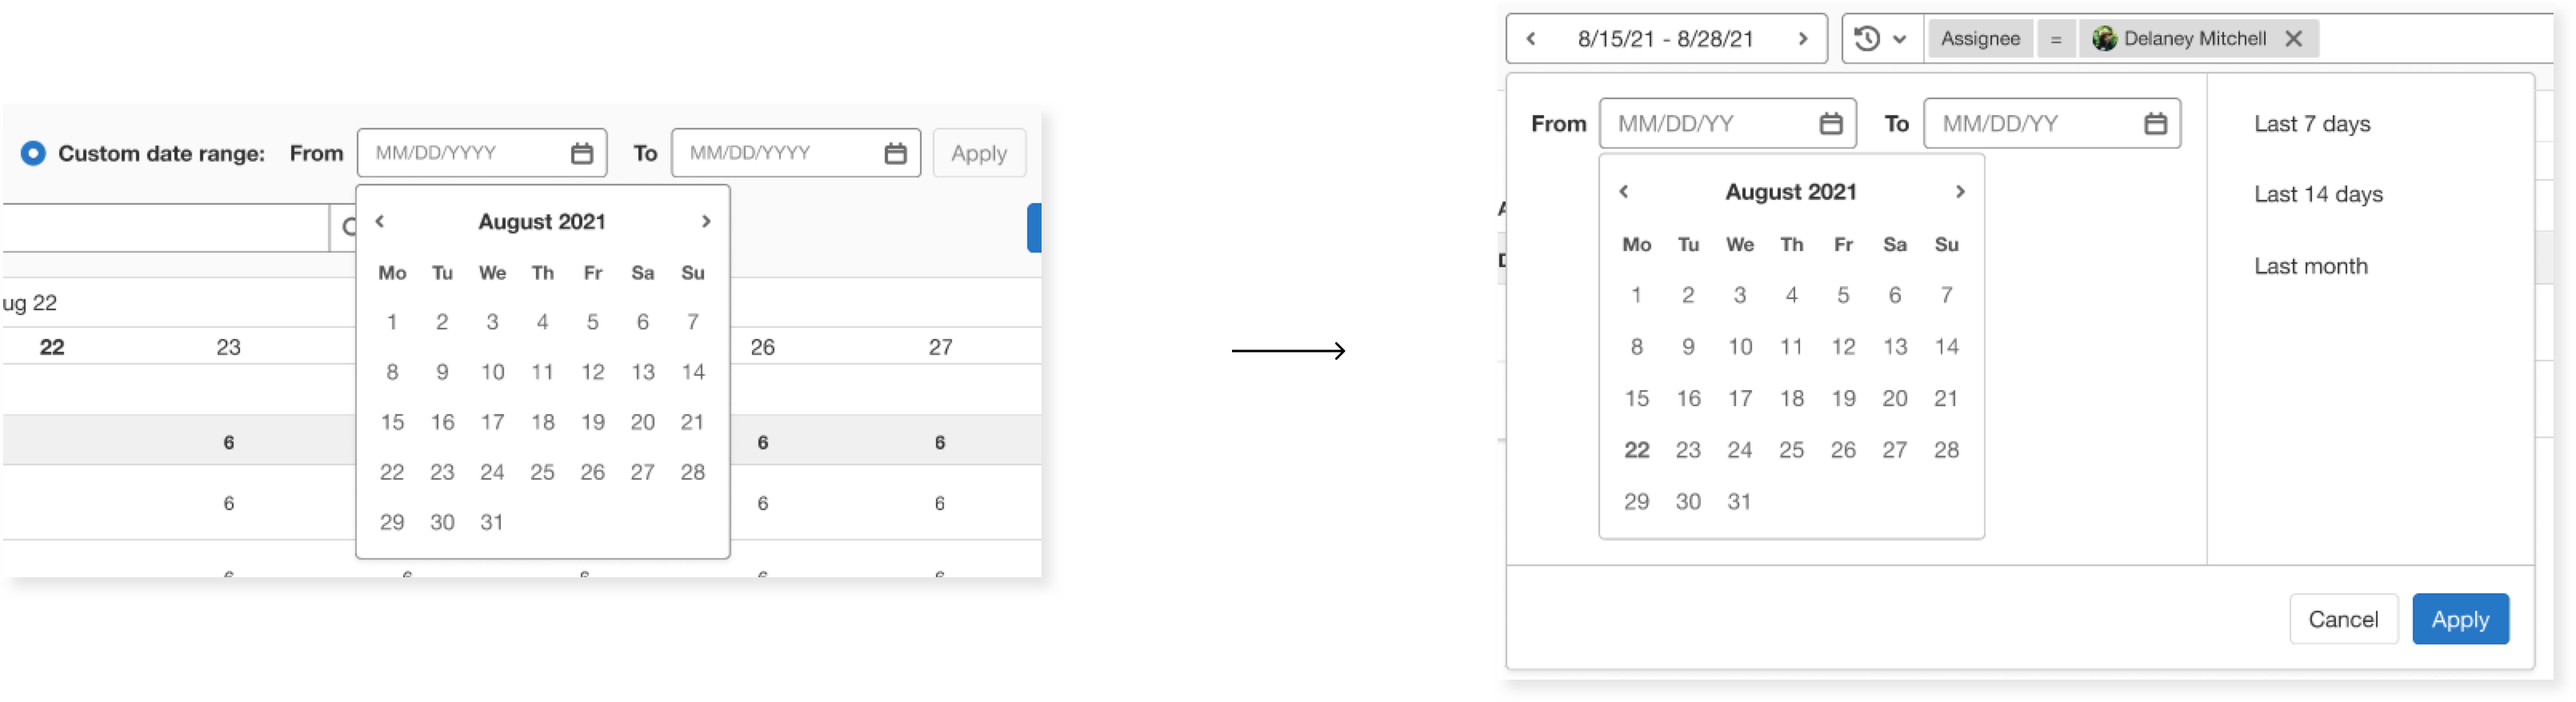
Consolidating the date options into a dropdown was a decision made from usability test insights and research calendar picker design patterns.
Next Steps
- Perform another round of testing to evaluate the usability of the revisions made in version 2
- Establish a baseline task time for items to be tested, for potential A/B testing to determine the best iteration of the report
- Collaborate with team members from GitLab to gain insight into how the project solves problems for users
Reflecting On The Project
Constraints and Challenges
- Working within GitLab’s Pajamas design system and maintaining the brand message in the designs
- Limited resources that limit optimal research conditions
Takeaways
- In order to design an effective solution, extensive research was required on my end to understand GitLab’s values and direction
- Understanding the information architecture of GitLab was important in crafting a practical solution, rather than blindly adding elements that would not have aligned with their data
For the Future
The challenging part of this project was empathizing with the various roles that time tracking would be designed for. Without the ideal resources to perform necessary research, I was left anticipating the needs of other users. I needed to learn to step back and utilize the research I did complete. Iteration and incremental improvements in the future is key to reaching a good product.